Dispatcher for the various htaBIM plot types. Calls the appropriate
plotting function based on the type argument.
Arguments
- x
A
bim_modelobject.- type
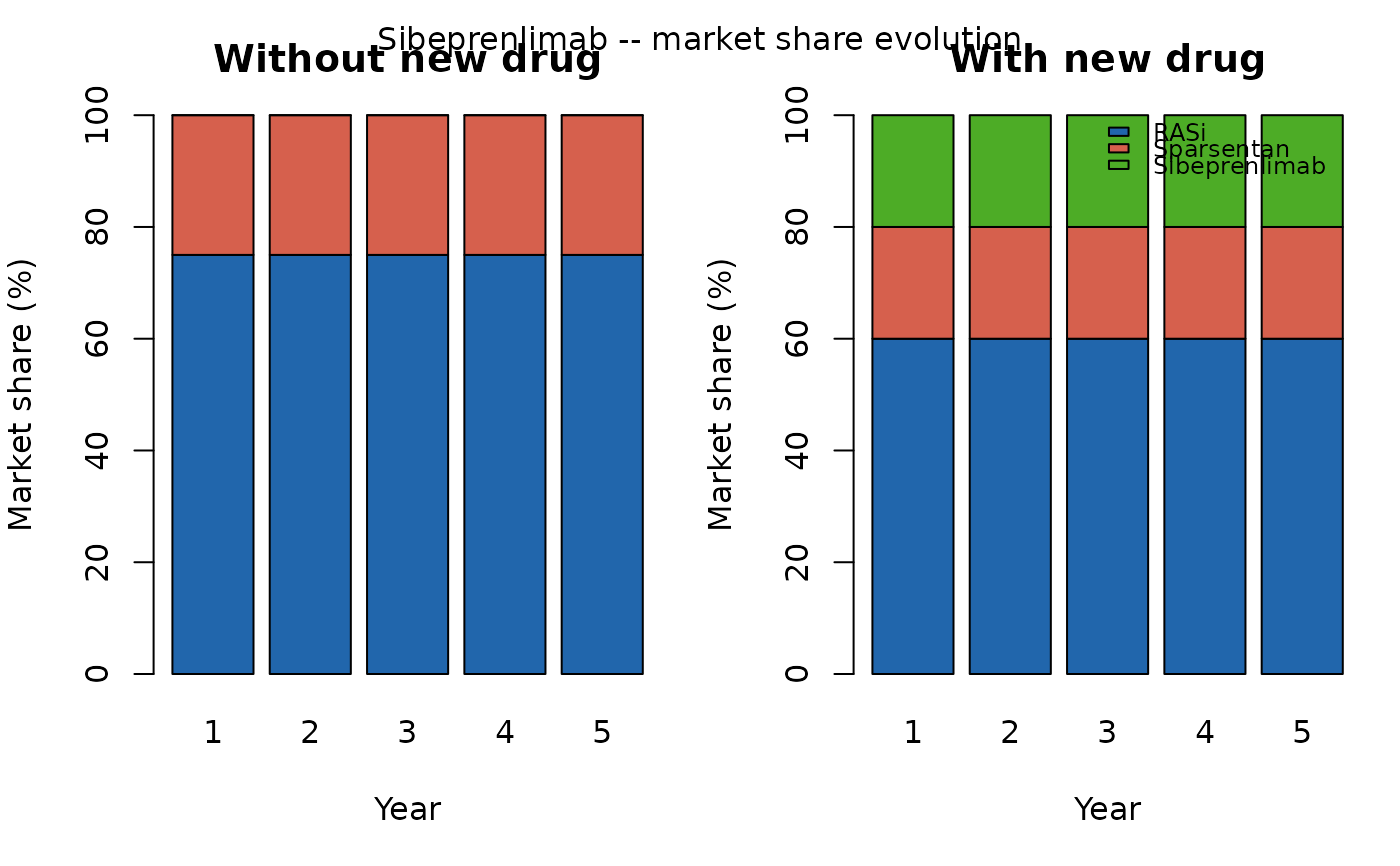
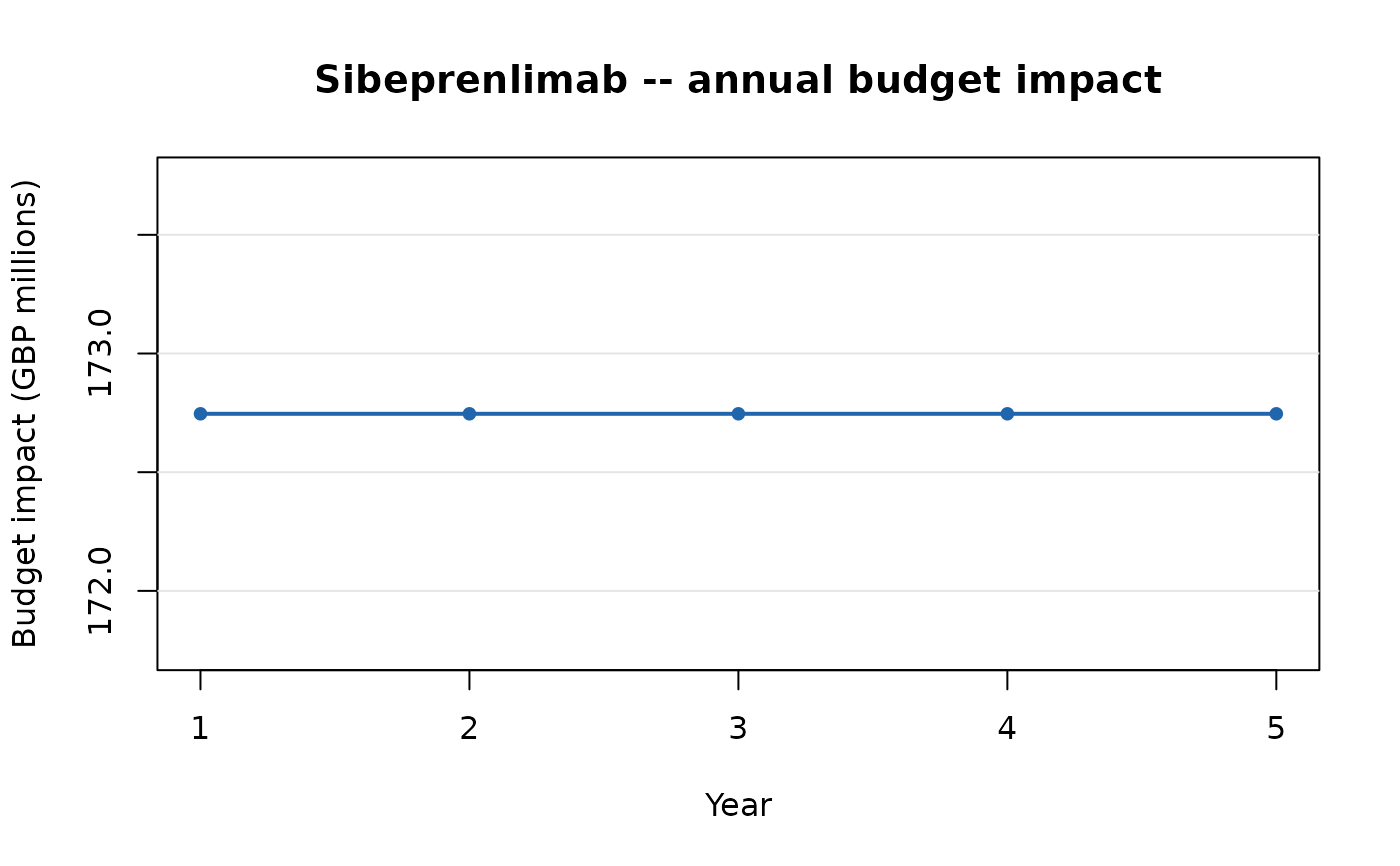
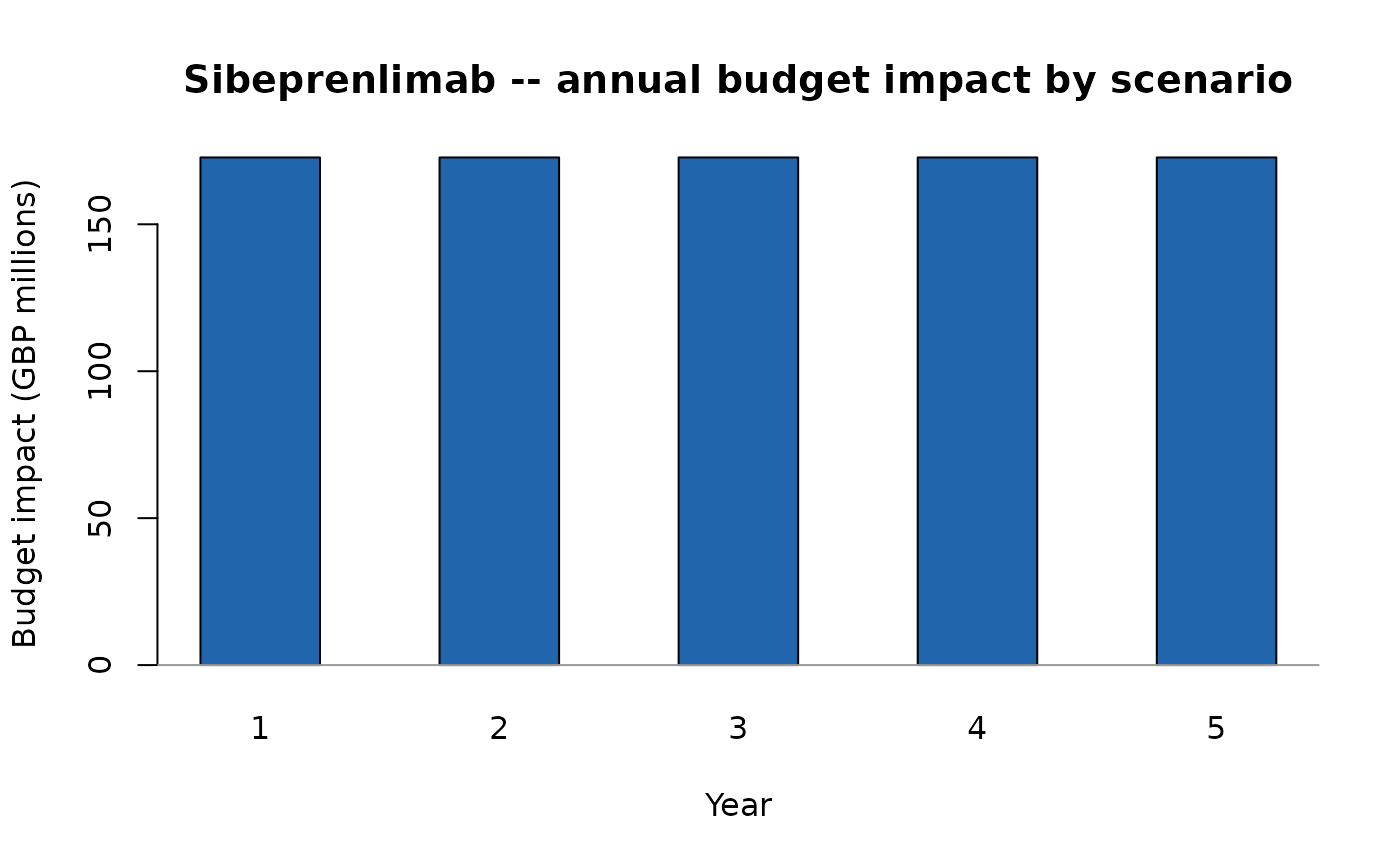
character(1). Plot type:"line"– annual budget impact over time (default)."bar"– grouped bar chart by year and scenario."tornado"– DSA tornado diagram (requiresdsaargument)."shares"– market share stacked bar chart.
- ...
Additional arguments passed to the specific plot function.
Examples
pop <- bim_population(
  indication    = "Disease X",
  country       = "GB",
  years         = 1:5,
  prevalence    = 0.003,
  n_total_pop   = 42e6,
  eligible_rate = 0.30
)
ms <- bim_market_share(
  population     = pop,
  treatments     = c("RASi", "Sparsentan", "Sibeprenlimab"),
  new_drug       = "Sibeprenlimab",
  shares_current = c(RASi = 0.75, Sparsentan = 0.25, Sibeprenlimab = 0.00),
  shares_new     = c(RASi = 0.60, Sparsentan = 0.20, Sibeprenlimab = 0.20)
)
costs <- bim_costs(
  treatments = c("RASi", "Sparsentan", "Sibeprenlimab"),
  drug_costs = c(RASi = 200, Sparsentan = 22000, Sibeprenlimab = 28500)
)
model <- bim_model(pop, ms, costs)
plot(model, type = "line")

plot(model, type = "bar")

plot(model, type = "shares")