Inequality Measurement in DCEA
Source:vignettes/v04_inequality_measures.Rmd
v04_inequality_measures.RmdOverview
dceasimR provides five inequality measures commonly used
in DCEA: SII, RII, concentration index, Atkinson index, and Gini
coefficient.
Slope Index of Inequality (SII)
The SII estimates the absolute health difference from the most to the least deprived using a weighted regression on ridit scores.
calc_sii(df, "mean_hale", "group", "pop_share")
#> $sii
#> [1] 18.15
#>
#> $rii
#> [1] 0.304326
#>
#> $se_sii
#> [1] 0.4112988
#>
#> $p_value
#> [1] 2.561597e-05
#>
#> $model
#>
#> Call:
#> stats::lm(formula = h ~ ridit, weights = w)
#>
#> Coefficients:
#> (Intercept)        ridit
#>       50.56        18.15
A positive SII means better health in more advantaged groups.
Relative Index of Inequality (RII)
The RII expresses the SII relative to mean health, facilitating comparisons across populations and time.
calc_rii(df, "mean_hale", "group", "pop_share")
#> $sii
#> [1] 18.15
#>
#> $rii
#> [1] 0.304326
#>
#> $se_sii
#> [1] 0.4112988
#>
#> $p_value
#> [1] 2.561597e-05
#>
#> $model
#>
#> Call:
#> stats::lm(formula = h ~ ridit, weights = w)
#>
#> Coefficients:
#> (Intercept)        ridit
#>       50.56        18.15
#>
#>
#> $se_rii
#> [1] 0.006896357
Concentration Index
calc_concentration_index(df, "mean_hale", "group", "pop_share",
                          type = "standard")
#> $ci
#> [1] 0.04869215
#>
#> $se
#> [1] NA
#>
#> $type
#> [1] "standard"
Atkinson Index
calc_atkinson_index(df$mean_hale, df$pop_share, epsilon = 1)
#> [1] 0.003744955
Gini Coefficient
calc_gini(df$mean_hale, df$pop_share)
#> [1] 0.04869215
All indices at once
calc_all_inequality_indices(df, "mean_hale", "group", "pop_share",
epsilon_values = c(0.5, 1, 2))
#> # A tibble: 7 × 3
#> index value description
#> <chr> <dbl> <chr>
#> 1 sii 18.2 Slope Index of Inequality
#> 2 rii 0.304 Relative Index of Inequality
#> 3 concentration_index 0.0487 Concentration Index (standard)
#> 4 gini 0.0487 Gini coefficient
#> 5 atkinson_epsilon_0.5 0.00187 Atkinson index (epsilon = 0.5)
#> 6 atkinson_epsilon_1 0.00374 Atkinson index (epsilon = 1)
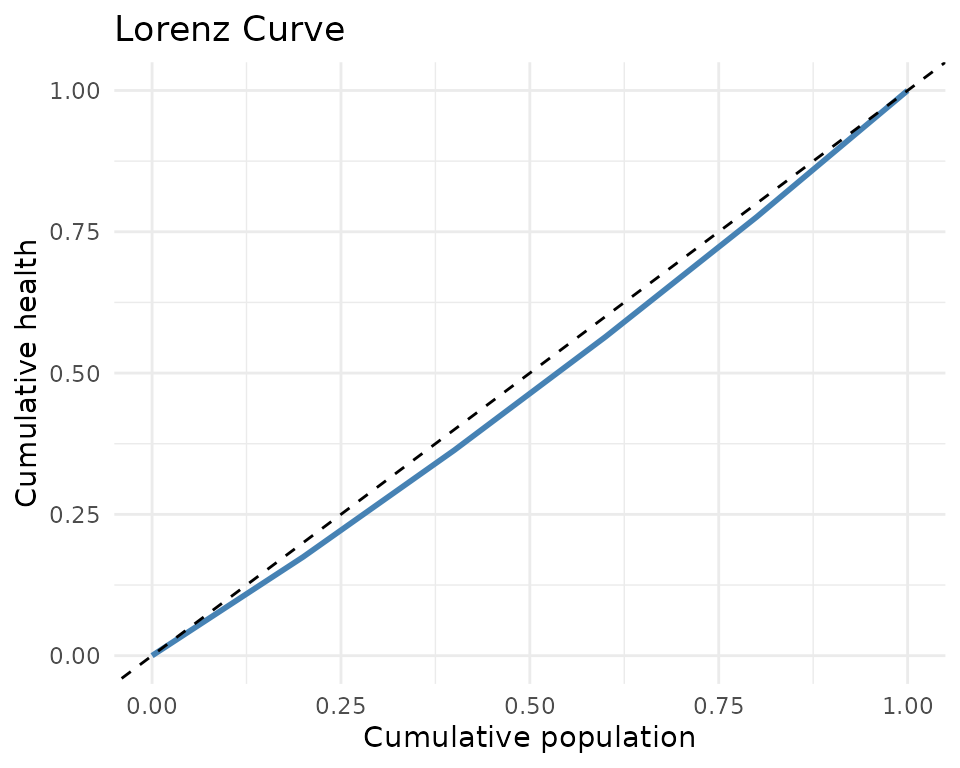
#> 7 atkinson_epsilon_2 0.00751 Atkinson index (epsilon = 2)Lorenz curves
ld <- compute_lorenz_data(df$mean_hale, df$pop_share, "England 2019")
library(ggplot2)
ggplot(ld, aes(cum_pop, cum_health)) +
  geom_line(colour = "steelblue", linewidth = 1) +
  geom_abline(linetype = "dashed") +
  labs(x = "Cumulative population", y = "Cumulative health",
       title = "Lorenz Curve") +
  theme_minimal()