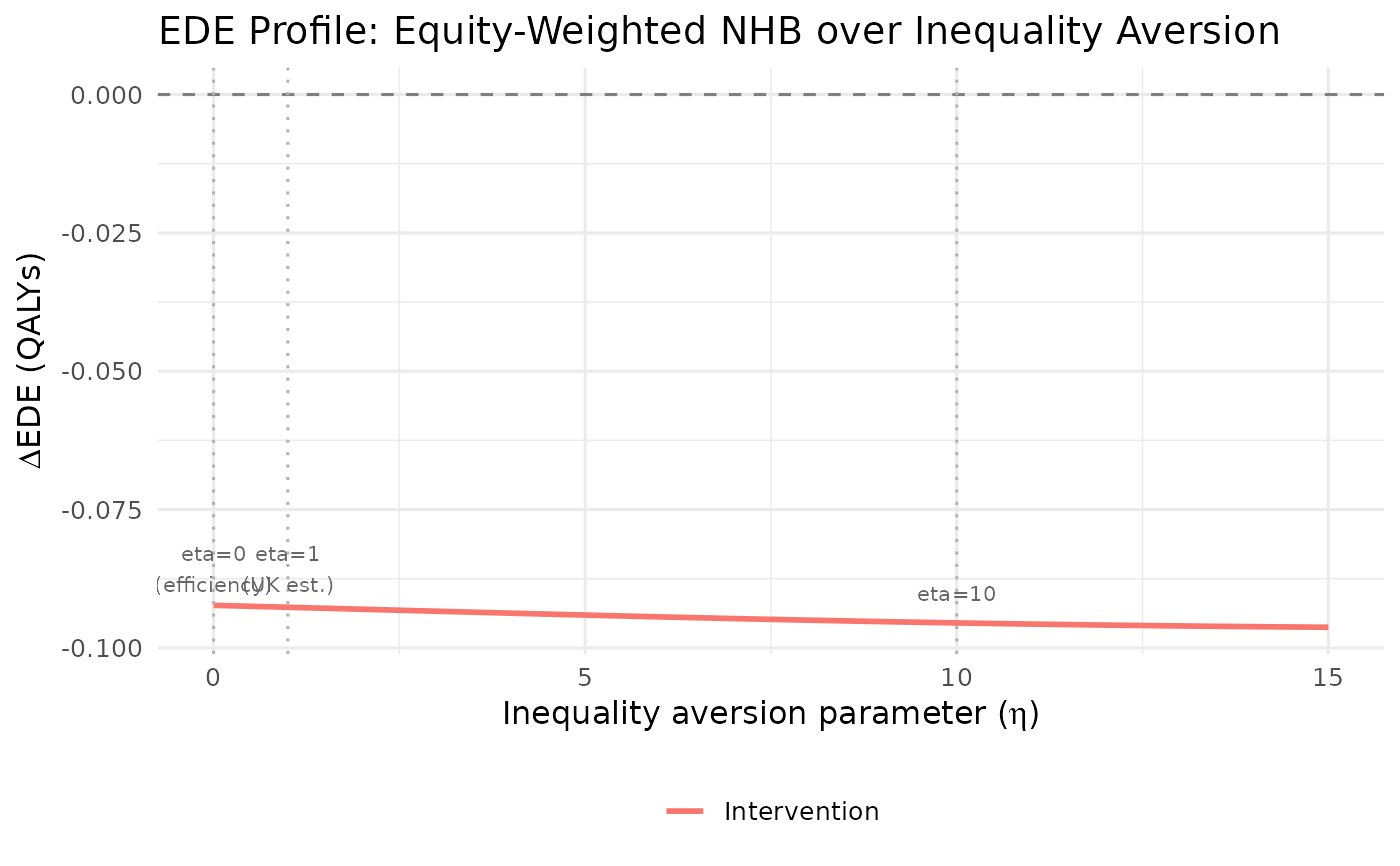
Shows how equity-weighted NHB (or EDE health) changes as inequality aversion (\(\eta\)) increases. The profile reveals the critical \(\eta\) at which an intervention becomes welfare-improving after accounting for equity concerns.
Usage
plot_ede_profile(
  dcea_result,
  eta_range = seq(0, 15, 0.1),
  comparators = NULL,
  show_benchmark_eta = TRUE
)
Arguments
- dcea_result
DCEA result object.
- eta_range
Numeric vector of \(\eta\) values (default:
seq(0, 15, 0.1)).- comparators
Optional list of additional DCEA result objects to overlay on the same plot.
- show_benchmark_eta
Logical. Mark commonly used \(\eta\) values (0 = efficiency only; 1 = Robson et al. UK estimate; 10 = strong aversion; default:
TRUE).
Examples
result <- run_aggregate_dcea(
  icer = 25000, inc_qaly = 0.5, inc_cost = 12500,
  population_size = 10000, wtp = 20000
)
plot_ede_profile(result)